
스크럽대디: 수세미가 아니라 '주방의 디자인 오브제'
출시 전 컨셉·가격, 망설인 응답자 인터뷰, 하위 라인업의 가격과 모양까지. 한 브랜드가 10개월 동안 합성소비자에게 이어서 물은 네 번의 조사입니다.
스크럽대디의 동의를 받아 싣는 고객 사례입니다. 이 글의 모든 수치는 실제 프로젝트에서 나온 합성소비자 응답 결과입니다.
고객과 질문
미국 주방 수세미 브랜드 스크럽대디는 한국 시장에서 이 브랜드를 어떻게 팔지 정해야 했습니다. 한국에서 스크럽대디를 판매하는 팀은 2025년 4월부터 2026년 1월까지 10개월 동안 TheSurvey.ai로 네 번의 조사를 했습니다.
| 조사 | 시기 | 질문 | 응답자 |
|---|---|---|---|
| 1. 컨셉과 가격 | 2025년 4~5월 | 이 컨셉이 한국에서 경쟁력이 있나, 적정 가격은 얼마인가? | 30~40대 여성 합성소비자 300명 |
| 2. 같은 응답자 인터뷰 | 1차 조사 직후 | 왜 구매의향만 다른 항목보다 낮을까? | 1차 조사에서 구매를 망설인 73명 |
| 3. 스크럽베이비 가격 | 2025년 12월 | 기존 제품을 잠식하지 않으면서 전체 매출을 늘리는 가격은? | 가격 3안 비교 |
| 4. 스크럽베이비 모양 | 2026년 1월 | 세 가지 모양 중 무엇으로 출시할까? | 시안 3개, 5개 항목 |
처음 두 번은 브랜드를 파는 방식을 정했고, 나머지 두 번은 하위 라인업 ’스크럽베이비’를 더할 때 진행했습니다.
1. 출시 전 컨셉과 가격 (2025년 4~5월)
30~40대 여성 합성소비자 300명에게 아래 컨셉보드를 그대로 보여 주고, 여섯 항목을 5점 척도로 물은 뒤 3개입 기준 적정 가격(PSM)을 물었습니다. 보드는 세척 성능을 앞에 두고, 디자인은 마지막에 ’한 가지 더’로 붙였습니다.
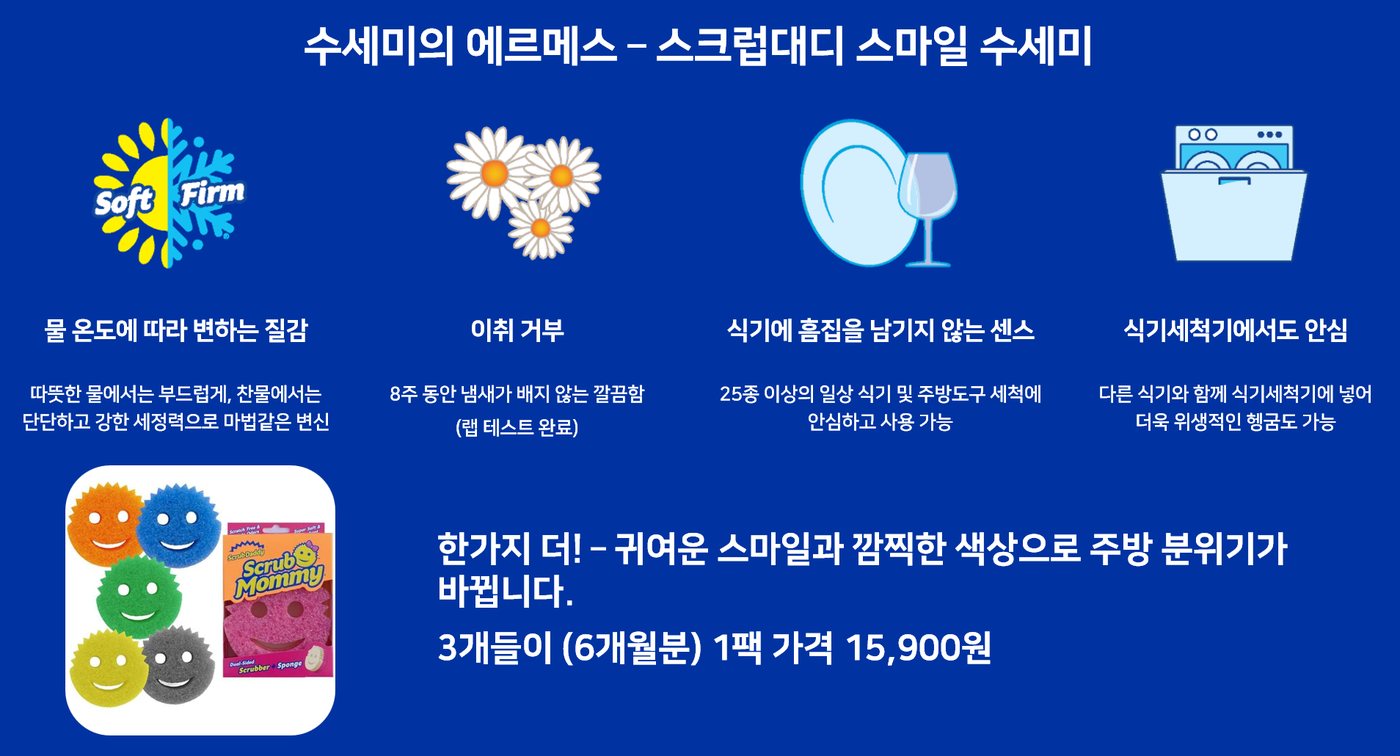
여섯 항목 중 다섯 개는 긍정률(Top 2)이 82%를 넘었습니다. 구매의향만 75.7%에 그쳤습니다.
| 항목 | 매우 긍정 | 다소 긍정 | 보통 | 다소 부정 | 긍정률 (Top 2) | 5점 평균 |
|---|---|---|---|---|---|---|
| 전반 만족도 | 22.7% | 60.0% | 15.7% | 1.7% | 82.7% | 4.04 |
| 새로움 | 27.0% | 71.7% | 1.3% | 0% | 98.7% | 4.26 |
| 차별성 | 27.7% | 70.0% | 2.3% | 0% | 97.7% | 4.25 |
| 필요성 | 25.0% | 67.3% | 7.3% | 0.3% | 92.3% | 4.17 |
| 신뢰도 | 19.3% | 64.7% | 15.7% | 0.3% | 84.0% | 4.03 |
| 구매의향 | 9.7% | 66.0% | 18.0% | 6.3% | 75.7% | 3.79 |
’매우 부정’은 한 명도 없었습니다. 반올림 때문에 비율 합이 정확히 100%가 아닐 수 있습니다.
3개입 적정 가격(PSM)은 11,000원으로, 보드에 적힌 15,900원보다 약 30% 낮았습니다. 보고서는 가격 부담을 구매의향이 다른 항목보다 낮게 나온 이유 중 하나로 봤습니다. 그런데 가격만으로는 설명이 다 되지 않았습니다.
2. 왜 사지 않을까: 같은 응답자에게 다시 묻기 (IDI)
설문은 어디서 숫자가 낮은지 보여 주지만, 왜 낮은지는 잘 보여 주지 않습니다. 합성소비자는 설문에 답한 바로 그 응답자에게 자기 답변에 대한 후속 질문을 할 수 있습니다.
300명 중 구매의향에서 Top 2를 고르지 않은 응답자는 73명(24.3%)이었습니다. 보통 18.0%, 다소 부정 6.3%입니다. 이 그룹을 다시 불러 제품을 어떻게 쓸지, 무엇 때문에 망설이는지 심층 인터뷰를 했습니다.
“부엌에 두었다가 깨끗한 그릇을 닦을 때나 손님이 올 때 쓰고, 더러운 건 다른 수세미로 닦아요.” (합성소비자 심층 인터뷰 응답)
같은 프로젝트의 사용 실태(U&A) 문항도 같은 방향을 가리켰습니다. 경쟁 브랜드는 익명으로 처리했습니다.
| 주로 쓰는 주방 수세미 (단일 선택) | 비율 |
|---|---|
| 1위 브랜드 | 43% |
| PB·저가 제품 | 26% |
| 스크럽대디 | 20% |
| 브랜드 B | 4% |
| 모름 | 3% |
| 브랜드 C | 2% |
| 브랜드 D | 2% |
집에 있는 수세미를 복수로 고르게 하면, 스크럽대디를 가진 응답자 20.1% 중 12.6%는 다른 수세미도 함께 둡니다. 가장 많이 겹치는 건 1위 브랜드로, 둘만 가진 비율이 9.7%입니다. PB·저가 제품하고만 겹치는 비율은 2.1%, 세 가지를 다 가진 비율은 0.8%입니다. 스크럽대디만 가진 응답자는 7.5%입니다.
결론은 이랬습니다. 스크럽대디는 주방의 디자인 오브제이지, 일상 소모품이 아닙니다. 깨끗한 그릇을 닦거나 손님이 올 때 쓰고, 지저분한 설거지는 더 싼 수세미로 합니다. 조사에 쓴 보드는 세척 성능을 앞세우고 디자인을 마지막에 언급했는데, 이후 메시지는 보이는 모습과 쓰는 장면을 앞세우는 쪽으로 바뀌었습니다.
3. 하위 라인업 가격 (2025년 12월)
스크럽베이비는 스크럽대디 옆에 놓이는 하위 라인업입니다. 가격이 낮으면 신규 구매자를 끌어올 수 있지만, 가격 차이가 크면 기존 구매자가 주력 제품에서 옮겨 갈 수도 있습니다. 가격 3안(각각 1개입·3개입 가격)을 두 효과로 비교했습니다. 가격대별 신규·기존 구매자의 설문 응답을 브랜드의 장기 매출 지수로 환산한 값입니다.
| 가격 3안 | 장기 전체 매출 지수 (현재 = 100) |
|---|---|
| 가장 높은 가격 | 112.3 |
| 중간 가격 (1개입 4,780원) | 120.8 |
| 가장 낮은 가격 | 128.0 |
세 가격 모두 전체 매출을 늘렸습니다. 가장 낮은 가격이 장기 성장은 가장 컸지만, 가격 차이도 가장 커서 단기적으로 기존 스크럽대디 구매자가 더 싼 라인으로 옮겨 갈 위험이 있습니다. 그래서 성장의 대부분을 지키면서 가격 차이를 줄이는 중간 가격, 1개입 4,780원을 추천했습니다. 신규 유입 효과를 확인한 뒤 할인·프로모션을 더하는 방안도 함께 제안했습니다. 지수는 신규 30%, 기존 70%의 단순 모형이며 구매 주기는 반영하지 않았습니다.
“실제 판매가가 추천하신 판매가와 유사하게 설정될 것 같습니다.” (스크럽대디 담당자)
4. 하위 라인업 모양 3안 (2026년 1월)
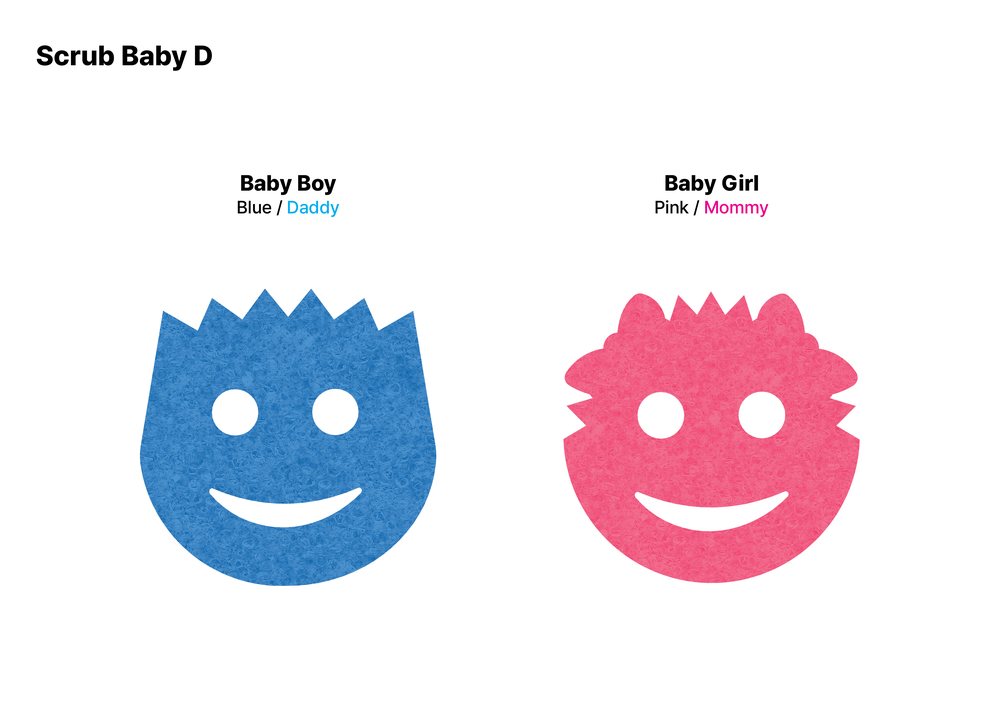
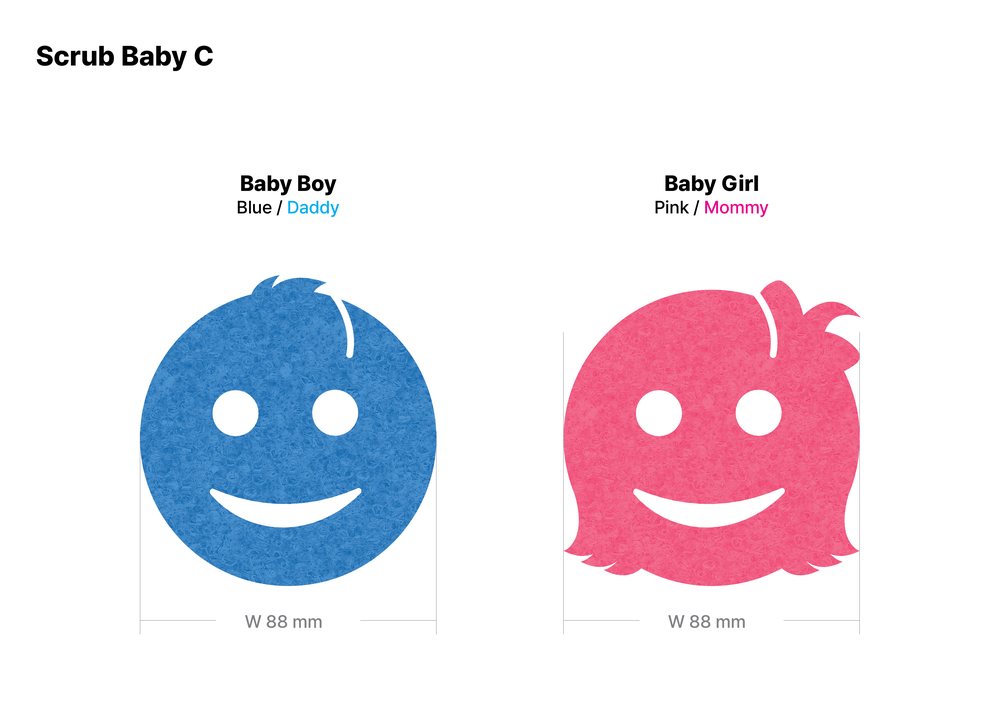
스크럽베이비 모양 시안 3개를 파랑·분홍 버전으로 보여 줬습니다. 응답자는 먼저 머리 부분의 쓰임새 안내를 읽고, 시안마다 다섯 항목(최초 선호도, 세밀 세척, 그립감, 위트, 구매의향)을 5점 척도로 평가했습니다. 몇 살처럼 보이는지와 첫인상 키워드는 주관식으로 물었습니다.
응답자가 먼저 읽은 안내: “머리의 틈새는 숟가락이나 컵 입구를 닦는 부분입니다. 세 시안 모두 스크럽대디처럼 눈으로 젓가락을, 입으로 숟가락을 닦을 수 있습니다.”
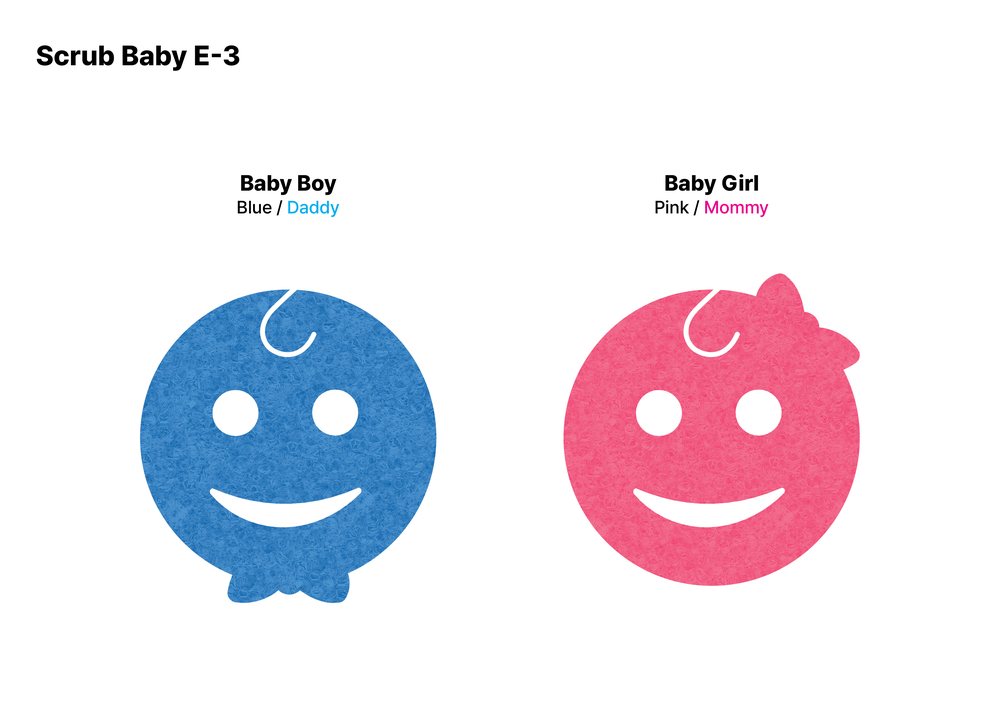
| 5점 평균 | 시안 1 | 시안 2 | 시안 3 |
|---|---|---|---|
| 최초 선호도 | 4.03 | 4.15 | 4.10 |
| 세밀 세척 | 4.09 | 4.07 | 4.10 |
| 그립감 | 4.04 | 4.09 | 4.04 |
| 위트 | 4.00 | 4.08 | 4.03 |
| 구매의향 | 4.16 | 4.24 | 4.28 |
| 총점 (다섯 항목 평균) | 4.06 | 4.13 | 4.11 |
세 시안 모두 4.0점 이상이었습니다. 최초 선호도·그립감·위트는 시안 2, 세밀 세척·구매의향은 시안 3이 가장 높았습니다. 시안 1은 1위 항목이 없지만 모든 항목에서 최고점과의 차이가 0.12 이내였습니다. 총점은 시안 2, 구매의향은 시안 3이 앞선 셈이라, 어느 쪽을 고를지는 출시 목표에 따라 갈립니다.
참고
- 모든 결과는 한국 합성소비자의 응답이며 집단 수준으로 읽습니다. 실제 판매 실적이 아닙니다.
- 1차 조사의 비율은 반올림 때문에 합이 정확히 100%가 아닐 수 있습니다.
- 3차 조사의 지수는 신규 30%, 기존 70%의 단순 모형이며 구매 주기는 반영하지 않았습니다.
이런 질문에 씁니다
- 출시 전에 컨셉과 가격을 함께 확인하고 싶을 때
- 숫자가 애매할 때, 같은 응답자에게 바로 이유를 묻고 싶을 때
- 하위 라인업이 기존 제품을 잠식하지 않을 가격을 찾고 싶을 때
- 디자인 시안을 출시 전에 비교하고 싶을 때
This customer story is published with Scrub Daddy’s consent. Every figure in this post is a synthetic consumer result from the actual project.
The client and the questions
Scrub Daddy, a US kitchen sponge brand, had to decide how to sell in Korea. Over ten months, from April 2025 to January 2026, the team that sells Scrub Daddy in Korea ran four studies on TheSurvey.ai.
| Study | When | Question | Respondents |
|---|---|---|---|
| 1. Concept and price | Apr–May 2025 | Is the concept competitive in Korea, and what price feels right? | 300 synthetic consumers, women aged 30–49 |
| 2. Interviews with the same respondents | Right after study 1 | Why does purchase intent trail every other measure? | The 73 who held back in study 1 |
| 3. Scrub Baby price | Dec 2025 | What price grows total sales without eating into the main product? | Three price points |
| 4. Scrub Baby shape | Jan 2026 | Which of three shapes should launch? | Three designs, five measures |
The first two studies shaped how the brand is sold. The next two came when the brand added its smaller line, Scrub Baby.
1. Concept and price before launch (April–May 2025)
We showed the concept board below, unchanged, to 300 synthetic consumers (women aged 30–49). They rated six measures on a 5-point scale and then answered price questions for a 3-pack (PSM). The board led with cleaning performance and added the design at the end, as “one more thing.”
Five of the six measures scored above 82% positive (top 2). Purchase intent reached only 75.7%.
| Measure | Very positive | Somewhat positive | Neutral | Somewhat negative | Positive (top 2) | Mean (5-point) |
|---|---|---|---|---|---|---|
| Overall satisfaction | 22.7% | 60.0% | 15.7% | 1.7% | 82.7% | 4.04 |
| Novelty | 27.0% | 71.7% | 1.3% | 0% | 98.7% | 4.26 |
| Differentiation | 27.7% | 70.0% | 2.3% | 0% | 97.7% | 4.25 |
| Need | 25.0% | 67.3% | 7.3% | 0.3% | 92.3% | 4.17 |
| Trust | 19.3% | 64.7% | 15.7% | 0.3% | 84.0% | 4.03 |
| Purchase intent | 9.7% | 66.0% | 18.0% | 6.3% | 75.7% | 3.79 |
No respondent chose “very negative.” Shares may not add up to exactly 100% because of rounding.
The optimal price for a 3-pack (PSM) came out at KRW 11,000 (about $8), about 30% below the KRW 15,900 on the board. The report saw the price as one reason purchase intent trailed the other measures. But price alone did not fully explain it.
2. Why not buy? Asking the same people again (IDI)
A survey shows where the numbers dip but rarely shows why. With synthetic consumers, you can go back to the same respondents and ask follow-up questions about their own answers.
Of the 300, 73 (24.3%) did not give a top-2 answer on purchase intent: 18.0% were neutral and 6.3% somewhat negative. We went back to that group with in-depth interviews, asking how they would use the product and what held them back.
“I keep it in the kitchen and use it for clean dishes or when guests come over. The dirty ones I wash with another sponge.” (synthetic consumer, in-depth interview)
The usage and attitude (U&A) questions in the same project pointed the same way. Competitor brands are anonymized.
| Main kitchen sponge (single choice) | Share |
|---|---|
| Category leader | 43% |
| Private label and budget sponges | 26% |
| Scrub Daddy | 20% |
| Brand B | 4% |
| Don’t know | 3% |
| Brand C | 2% |
| Brand D | 2% |
When asked which sponges they keep at home (multiple choice), 20.1% said they own a Scrub Daddy, and 12.6% of all respondents own one along with another sponge. The most common overlap is with the category leader: 9.7% own just those two. Another 2.1% own Scrub Daddy with only a budget sponge, and 0.8% own all three. The remaining 7.5% own a Scrub Daddy and nothing else.
We concluded that Scrub Daddy is a design object for the kitchen, not an everyday consumable. People keep it for clean dishes and for guests, and use a cheaper sponge for the dirty work. The tested board led with how well it cleans and mentioned the design last. Later messages lead with how it looks and the moments when people use it.
3. Price of the smaller line (December 2025)
Scrub Baby is a smaller line sold next to Scrub Daddy. A low price can bring in new buyers, but a steep price gap can also pull existing buyers away from the main product. We compared three price points, each with a single and a 3-pack price, on both effects. For each price, we turned survey answers from new and existing buyers into a long-term sales index for the brand.
| Price point | Long-term total sales index (today = 100) |
|---|---|
| Highest ($3.6 for a single) | 112.3 |
| Middle ($3.4 for a single) | 120.8 |
| Lowest ($3.3 for a single) | 128.0 |
All three price points grew total sales. The lowest price showed the most long-term growth, but also the steepest gap, which risks moving existing Scrub Daddy buyers to the cheaper line in the short term. So we recommended the middle price, about $3.4 for a single (KRW 4,780), which kept most of the growth with a smaller gap. We also suggested adding promotions once the effect on new buyers is clear. The index is a simple model with 30% new and 70% existing buyers; purchase cycles are not included.
“I think the actual selling price will be set close to the price you recommended.” (Scrub Daddy representative)
4. Three shapes for the smaller line (January 2026)
We showed three shape designs for Scrub Baby, each in a blue and a pink version. Respondents first read how the head is meant to be used, then rated each design on five measures (first impression, detail cleaning, grip, wit, purchase intent) on a 5-point scale. Two open questions asked how old each design looks and which words describe the first impression.
What respondents read first: “The gap in the head cleans spoons and cup rims. Like Scrub Daddy, all three designs clean chopsticks with the eyes and spoons with the mouth.”
| Mean (5-point) | Design 1 | Design 2 | Design 3 |
|---|---|---|---|
| First impression | 4.03 | 4.15 | 4.10 |
| Detail cleaning | 4.09 | 4.07 | 4.10 |
| Grip | 4.04 | 4.09 | 4.04 |
| Wit | 4.00 | 4.08 | 4.03 |
| Purchase intent | 4.16 | 4.24 | 4.28 |
| Total (mean of five) | 4.06 | 4.13 | 4.11 |
All three designs scored 4.0 or higher. Design 2 led on first impression, grip and wit; Design 3 on detail cleaning and purchase intent. Design 1 did not lead on any measure, but it stayed within 0.12 of the top score on every one. Design 2 wins on total and Design 3 on purchase intent, so the choice depends on the launch goal.
Notes
- All results are answers from synthetic consumers in Korea and should be read at the group level. They are not sales figures.
- Study 1 shares may not add up to exactly 100% because of rounding.
- The study 3 index is a simple model with 30% new and 70% existing buyers; purchase cycles are not included.
Good for questions like these
- You want to check the concept and the price together before launch
- The numbers are unclear, and you want to ask the same respondents why, right away
- You want a price for a smaller line that does not eat into the existing product
- You want to compare design options before launch